
After a torrid 2022, the biggest companies in the US have had a resurgence in 2023.
The defining characteristic of these companies is that they are very big and very expensive. We have data going back to 1951 in the US so we can answer the question,“when has this happened before and how long has it lasted?”
To illustrate this, we have split the market in half between big and smaller sized companies and then we have further divided the big and smaller companies into three baskets of valuation from good value to expensive.
If you invested $1 in the “Big Expensive” bucket of stocks in 1951 you would have $1,016 by the end of June 2023. In comparison if you invested $1 in the “Smaller Good Value” bucket you would have $53,838 – over 50 times more!
Chart 1 – Long-run performance of smaller, better value companies in the US
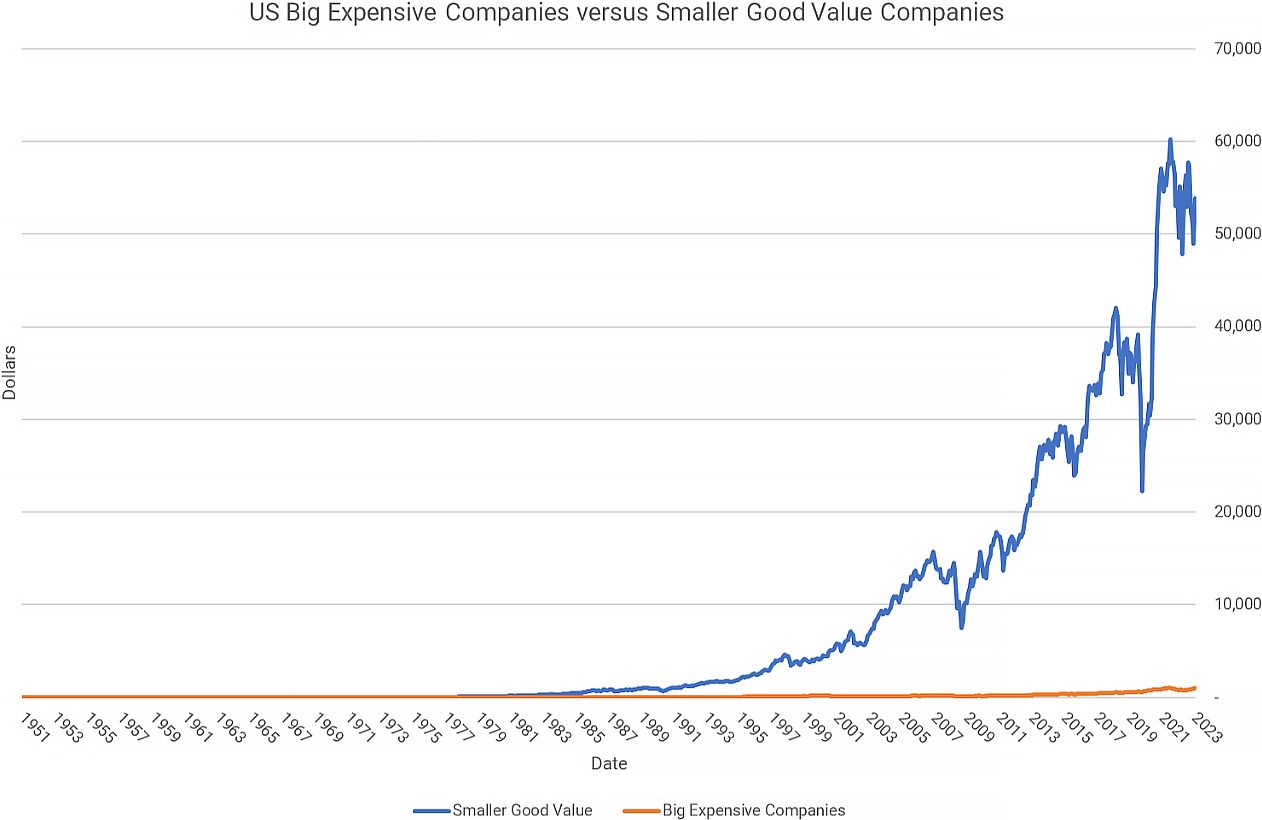
Source: Ken French Data Library, Courtiers
From a technical perspective, it’s difficult to identify the periods where “Big Expensive” companies have outperformed. If we take the logarithms (scale the numbers down for visual analysis) of the relative returns, we can remove the compounding effect and look at the periods when this has happened.
Chart 2 – Historic drawdowns of Big Expensive Companies relative to Smaller Good Value Companies
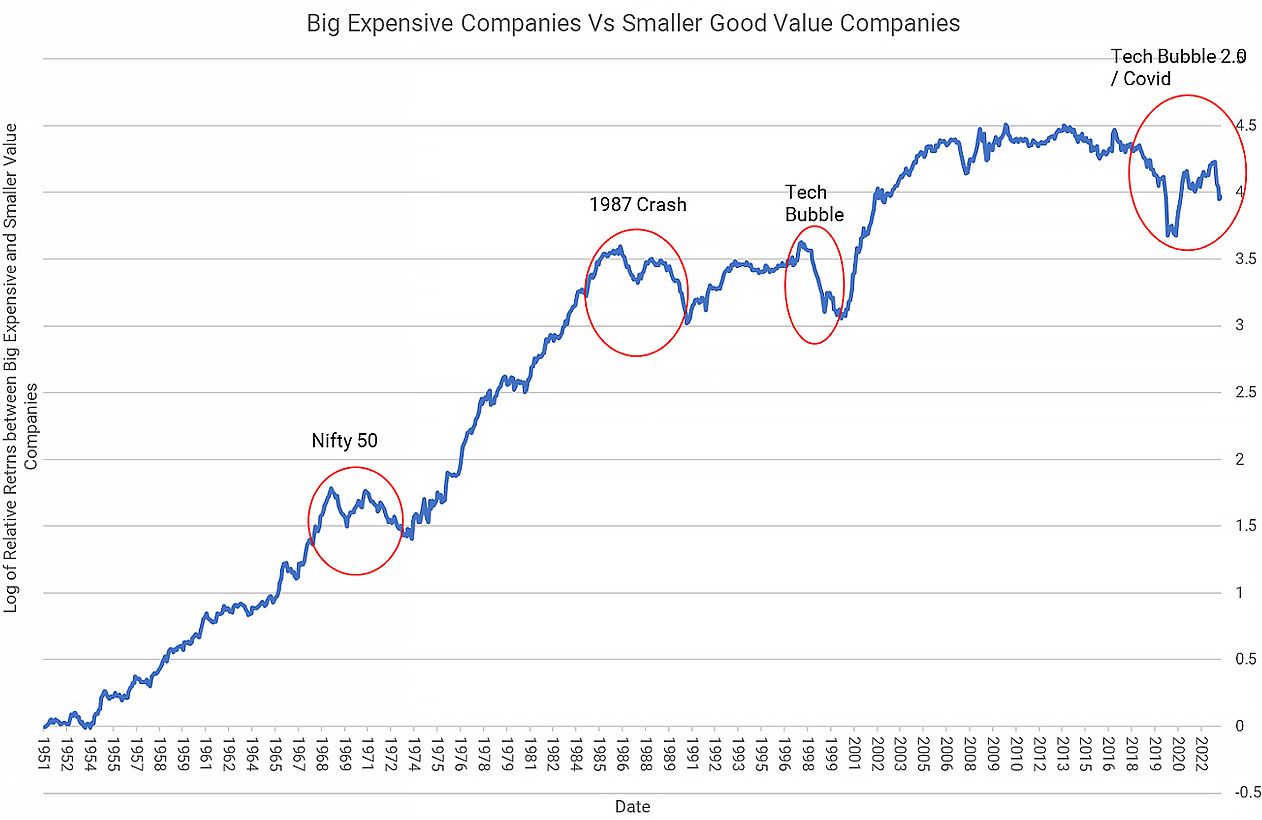
Source: Ken French Data Library, Courtiers
The biggest and most expensive companies outperforming the smallest and best value companies for prolonged periods of time are rare, but we can see three distinct occasions when this happened: the late 1960s, the late 1980s and the late 1990s.
Historically, these periods have lasted ~4 years. The late 1960s was the period of the “Nifty Fifty”, a group of fifty companies that were considered essential purchases for investors. Professor Jeremy Siegel highlighted in his book “Stocks for the Long Run” that these companies traded at excessive premiums and they consistently underperformed the broader market over the following 25 years.
The late 1980s was the last period that the largest 5 stocks made up over 20% of the S&P 500 (the most tracked US stock index). Back then the biggest stocks were not the likes of Apple or Amazon but Standard Oil of Indiana, Exxon, Schlumberger, IBM and AT&T. The reign of these stocks didn’t last long. The oil shortages of the 1980s would lead to an oil glut that would crash the price of oil, AT&T was broken up by regulators and IBM would go on to make the largest loss in American corporate history when they pursued development of mainframe computers in lieu of PCs.
The tech bubble of the late 1990s will be the most memorable of the highlighted periods. The 8 years that followed the tech bubble bursting were some of the best relative years for smaller good value companies versus big expensive companies.
Chart 3 – Spread between Big Expensive Companies relative to Smaller Good Value Companies
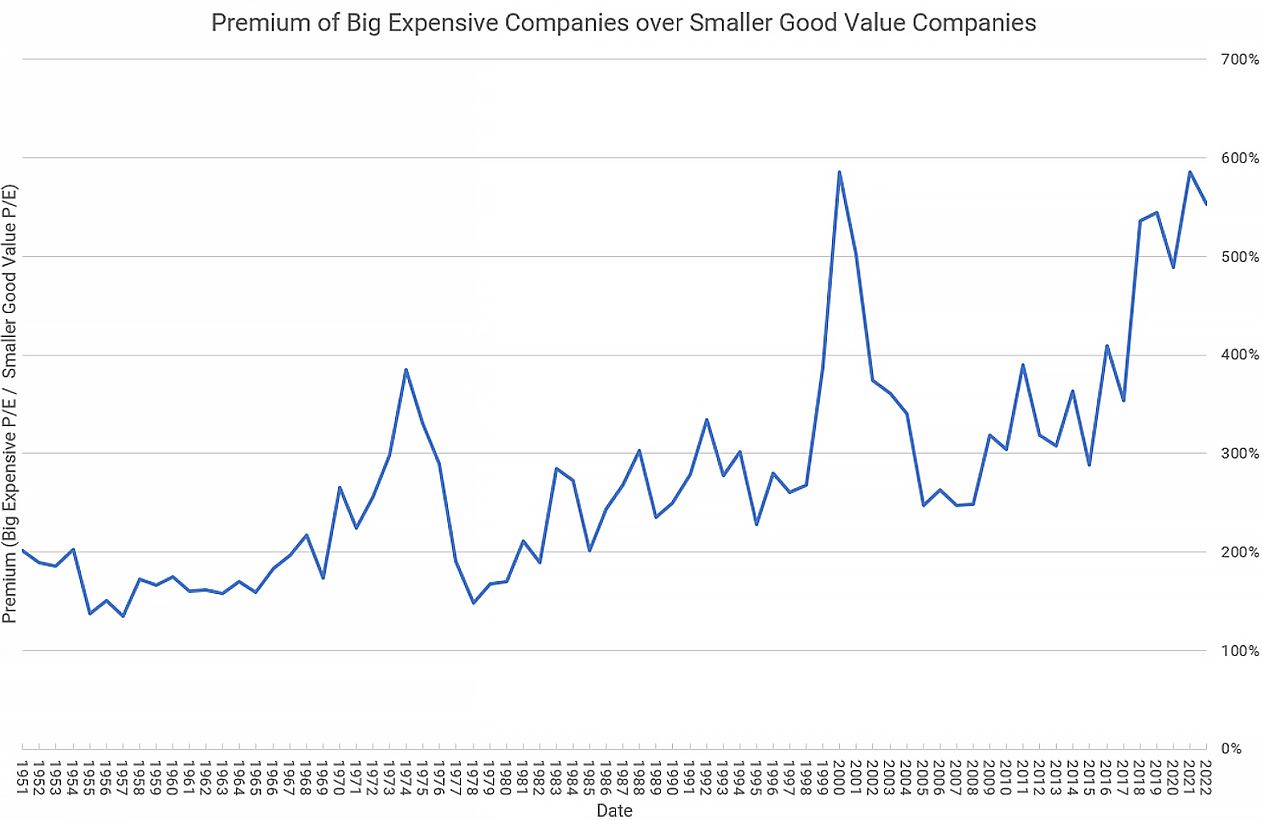
Source: Ken French Data Library, Courtiers
The current period of big expensive stocks outperforming started in late 2017 with a bounce back at the end of 2020.It is impossible to say when this period will unwind but measuring the difference between the best value stocks and most expensive stocks tells us that the valuation gap is at record highs. History tells us that buying the smaller good value stocks is the best place for capital appreciation in the long-run – now, more than ever.